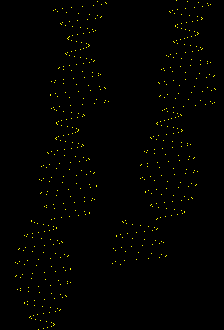

The frame display time for these animations was coded so that the larger animation runs
exactly 1/7 the speed of the short one. Some browsers don't support the timing codes, so
I have created AVI files as well. These are each about 500K. Single pulse AVI.
Seven pulse AVI.
What are you seeing here? Graphed here is a chart of the sequential New Moons,
starting from the top and progressing toward the bottom. Each successive
lunation is one pixel lower than the previous one. The horizontal position
is the difference between the true New Moon and a mean value of 29 26/49 days.
One pixel horizontally equals 1/49 day.
The large animation shows 767 consecutive lunations at a time for a duration
of 1.40 seconds. After 1.40 seconds, the next 767 lunations is shown.
The small animation shows 1/7 of the large animation. It advances exactly
seven times as fast, one frame every 0.20 seconds, advancing 767/7 lunations
each frame.
The result is that both animations cycle through time at the same rate.
The true mean lunation time is somewhat shorter than 29 26/49 days. Consequently,
the entire graph gradually shifts to the left over time.